The Health of the Poorest 50 Percent
No relationship is more clearly established in population health science than the one between income and health.
Read Time: 6 minutes
Published:

The Health of the Poorest 50 Percent
No relationship is more clearly established in population health science than the one between income and health. Those among us who are fortunate enough to have higher income live longer, healthier lives. By way of example, those born in 1960 who are in the lowest income quintile, can expect to live till age 76; those in the highest income quintile can expect to live till age 89. Money buys access to the resources that create a healthier life, from safe neighborhoods to walk in, to clean air to breathe, to time off to care for sick children, to nutritious food to eat. We write about this today, not because it is news, but because, quite simply, the United States is on the brink of creating a class of permanent health have-nots, shaped by entrenched class divides and ever increasing income disparity.
Pre-tax income for the poorest 50% of Americans has remained the same over the past 40 years, while their after-tax income has dropped as taxes have increased for this same group. Regressive taxation has deepened wealth gaps, virtually assuring a continuing cycle of low income earning. The national share of income owned by the richest 50% of Americans has grown commensurately during this period, and our health indicators have responded accordingly. The slope of the income-health relationship has grown even steeper since 2000; the health advantage that those with higher incomes have over those with lower incomes is greater than it has been in the past four or more decades. Going back to the example we started with, for those born in 1930, the poorest quintile could expect to live till age 77, the richest quintile until 82. The life expectancy gap has widened from 5 to 13 years. The rich have gained years while the poor have not.
Why is this? We as a country continue to invest less in the social resources that can mitigate the challenges that come with a lower income, even as we spend ever more on high-end medicine that is accessed principally by those who can afford it. Social institutions like education that traditionally have led to social mobility and better health have become increasingly the provenance of the well-off.
That about 1 out of every 2 Americans now have health and survival outcomes no better—and potentially worse—than those born decades earlier, is alarming. Should this not be on the front page of every newspaper every day?
Warmly,
Michael Stein & Sandro Galea

WHAT DO YOU GET FOR A PUBLIC HEALTH DOLLAR?
What is the most economically efficient way to deliver essential public health services? Without knowing the cost of delivery there can be no answer. One core public service provided by local health agencies is communicable disease surveillance: hunting for and reporting on sixty-one foodborne and vaccine-preventable conditions in populations. Colorado has more than 50 local and state agencies that work together whenever there is an outbreak of hepatitis A, Legionnaire’s disease, HIV, or other infections. This cost analysis shows that there are economics of scale in communicable disease surveillance (the cost per case decreases when there are greater numbers of cases) and suggests how employees might be most efficiently deployed. To gauge the value of public health services, taxpayers and their representatives need to know what they “get” for the increased investment.
HUMAN CONNECTION LESSENS POST-DISASTER FOOD INSECURITY
Five years after Hurricane Katrina, 22% of Gulf Coast families surveyed still faced problems getting adequate food, about twice the national average. Such food insecurity following any disaster is common, but this study demonstrated that food insecurity is not primarily driven by loss of housing or lack of money, but rather by the combination of physical and mental distress and loss of one’s sense of community and social support.

UNINSURED MOMS
Too often, pregnant women or women who recently give birth are uninsured. Jamie Daw and colleagues in Health Affairs describe the scope of the problem with health insurance changes, or ‘”churn,” for these women.
Churn can result in a lack of access to prenatal and postpartum care for women. Both are essential for the well-being of the mother and newborn.
Every state has a gap in Medicaid eligibility for pregnant women and parents or adults. For example, New York’s Medicaid system covers pregnant women up to 223% of the Federal Poverty Limit (FPL) and parents up to 138% of FPL. In the complicated world of health insurance coverage, pregnancy and childbirth often mean different options for women. Medicaid covers eligible pregnant women from conception to 60 days after childbirth. After 60 days, women must requalify for Medicaid under a lower threshold for parents, enroll in a private insurance plan, or simply be uninsured. Even though the Affordable Care Act requires maternity coverage, pregnancy is not a criterion to enroll during special enrollment periods (SEPs). Childbirth, however, is a SEP eligible event.
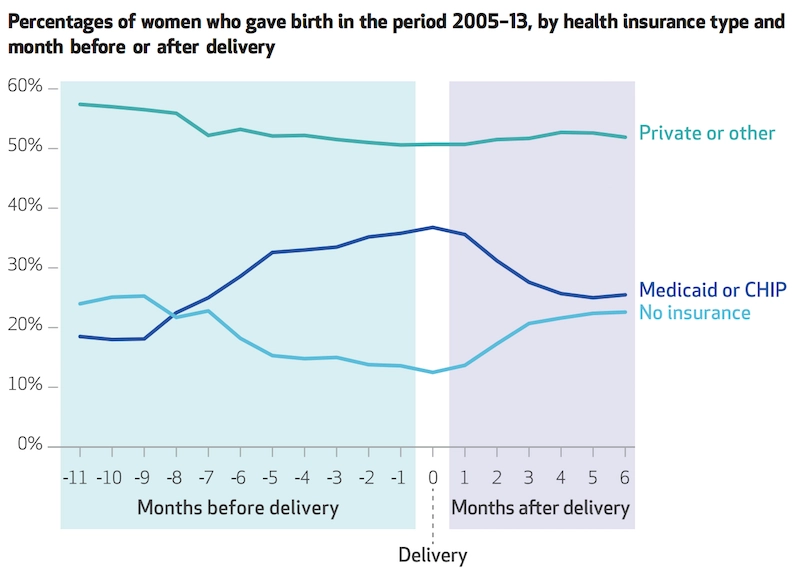
Daw’s study found that churn between programs disproportionately affects women who are uninsured or covered by Medicaid at the time of conception. Privately-insured women remained relatively stable in health insurance coverage. The number of uninsured women decreases up to the time of delivery with the lowest rate of uninsured during the month of childbirth. After delivery, the percentage of uninsured women rises and the percentage of women eligible for Medicaid or CHIP falls. Only 41% of women covered by Medicaid or CHIP have the same insurance in the six months following childbirth. The uninsurance rate after delivery returned to about the same rate as before conception.
Women most likely to experience loss in insurance coverage after childbirth are those who are unmarried, covered under Medicaid or CHIP during the delivery, live in southern states, fall between 100% to 185% of FPL, or do not speak English at home. Even women who change insurance but do not have a gap in coverage face obstacles. Daw and colleagues describe that a change in health plans can increase the chance of postponing care due to cost by 65% and lessens the odds of having a usual source of care by 37%.
The instability in insurance coverage for women during pregnancy and after childbirth can result in differential access to essential health care, impacting the health of both mothers and newborns. States should craft policies that promote continuity in coverage for reproductive-age women. —Qing Wai Wong, PHP Fellow
Graphic from Health Affairs Vol. 36, No. 4, “Women In The United States Experience High Rates Of Coverage ‘Churn’ In Months Before And After Childbirth, Jamie R. Daw, Laura A. Hatfield, Katherine Swartz, and Benjamin D. Sommers. Published April 2017. doi.org/10.1377/hlthaff.2016.1241