Can We Reverse Course on Health?
The United States lags behind our peer countries on key health indicators. Can we catch up in a few short decades?
Read Time: 5 minutes
Published:

Can We Reverse Course on Health?
The United States lags in health indicators behind all our high-income peer countries. Most well-informed readers know this and know that we have lower life expectancy and higher mortality on multiple causes than do, for example, Italy, Greece, France, or Norway. It is worth noting that our health measures were not always this poor compared to other countries; as recently as the mid-1980s we were roughly in the middle of the pack in high income countries and we have slowly fallen behind. Other countries have passed us, both high-income nations and other not so usual suspects like Chile, Cuba, and Singapore.
So the bad news is that we have fallen behind. The good news, perhaps, is that if we fell behind on health in such a short period of time, we can reverse course and catch up in the next few short decades.
But can we? A recent paper published in AJPH, the American Journal of Public Health, suggests that we cannot. The analysis found that to achieve United Nations projected mortality estimates for Western Europe by 2030, US life expectancy must grow at 0.32% a year between now and then. Fewer than 10% of US states have health improving at that pace or higher; this makes it highly unlikely that we are going to catch up and suggests, in fact, that we are going to fall further behind.
Why is this? Three explanations in our assessment.
First, much of the US gain in health and survival over the first half of the twentieth century has slowed down significantly in the latter half of the last century and the first two decades of this century. Just to give perspective, we gained 21 years in life expectancy between 1900 and 1950 and only 8.6 years between 1950 and 2000.
Second, we only excel at extending life for persons over 75. In this age group, we have lower mortality than other high-income countries. But these gains are diminishing perhaps as we start reaching natural limits of human lifespan.
Third, we continue to underfund in the foundational forces that shape health. Data show clearly that we continue to under-invest in forces such as education, efforts to promote healthy living, or preventive care, even in states like Massachusetts. Instead we spend our money on inefficient and expensive health services.
It seems odd that we should accept this state of affairs. Why does the United States spend more on health than any other country but get less out of our spending than our peers? Shouldn’t this be something that we talk about at every dinner table around the country until we change course?
Warmly,
Michael Stein & Sandro Galea

SORRY, NOT FOR YOU
In 2013, the Food and Drug Administration removed age restrictions on the over-the-counter sale of emergency contraception (EC). In this study, female researchers posing as 17-year-olds called pharmacies in five cities, and were told that EC was available in only 83% of the pharmacies. Pharmacies located in low-income neighborhoods gave misinformation and denied availability based on age more often than those in high-income areas. While this might not reflect what would happen at an in-person visit, barriers to access remain for adolescents despite change in FDA policy.
NEW FACES, NEW PLACES
In the past decade, we’ve seen the unprecedented dispersal of recent Latino, Black, and Asian immigrants into metropolitan areas with historically small immigrant populations. This analysis shows that recently legalized immigrants settling in “new” immigrant centers like Kansas City are more likely to live in areas with more Whites and fewer poor neighbors than those arriving in established immigrant cities like Chicago. Where a person lives matters. Residential location is a powerful determinant of many economic and social resources. It will be interesting to watch the life trajectories of our most recent arrivals.

THE COST OF KIDS’ NUTRITION
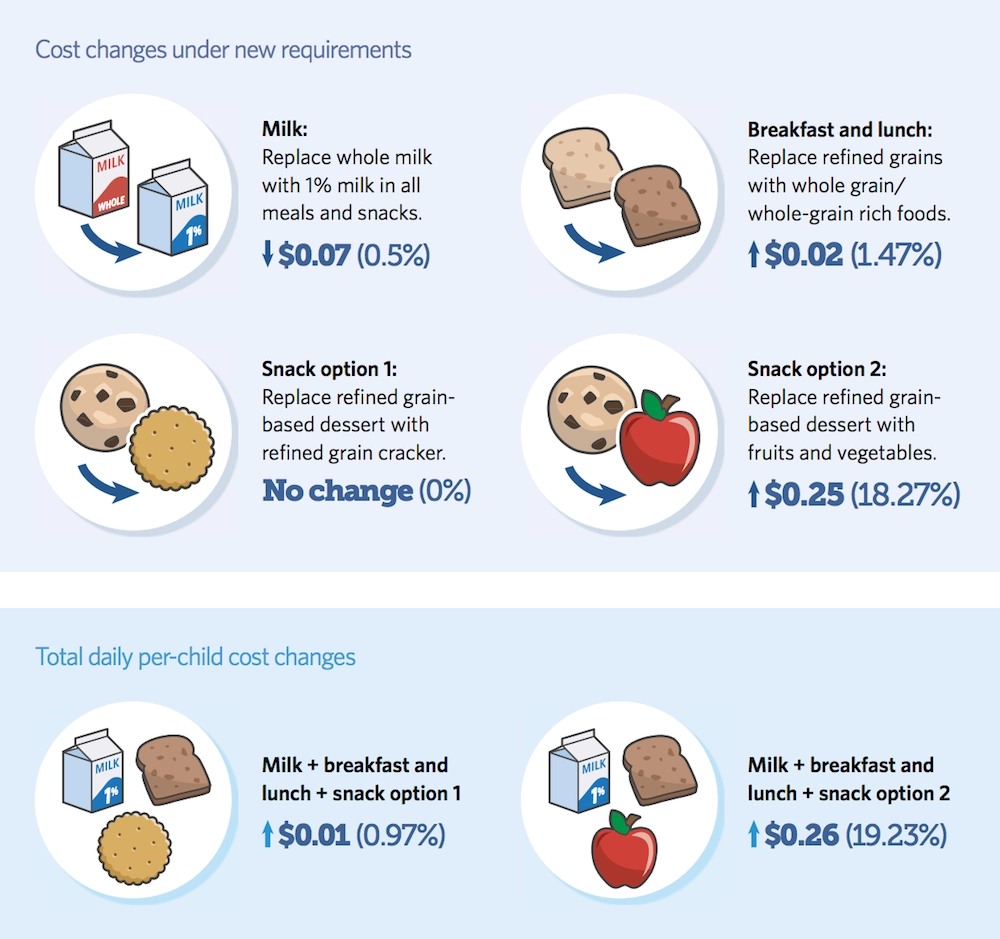
A new USDA rule requires meal providers participating in the Child and Adult Care Food Program (CACFP) to serve more whole grains, fruits, and vegetables as snacks. These programs serve over 4 million children daily in the United States and include child-care centers, after-school programs, and adult day care homes.
A September 2017 report by the Pew Charitable Trust found that improving food variety and quality comes at a cost beyond the reach of some meal providers. The figure above shows that incorporating more nutritious food can drive up daily per-child costs for providers by 26 cents. Snacks make up 36% of meals served by CACFP enrollees, and must incorporate at least two of the following: vegetables, fruits, grains, meat or meat alternatives, and fluid milk. Additionally, the new rule emphasizes serving low-fat milk and whole-grain foods, which can further increase cost.
Although CACFP reimburses participating meal providers, those in lower income settings may not have sufficient funds to purchase whole grain-rich and low-fat foods. One program serving about 200 children reported weekly costs rising by $200.
CACFP’s current reimbursement system limits compliance with the new USDA rule because some programs cannot afford to increase food spending. As a result, lower income providers may withdraw from the program, affecting the children they serve. Researchers recommend that state agencies and sponsors help providers implement the rule by offering training and resources to manage finances, especially when expenses continuously exceed revenue. — Sampada Nandyala, PHP Fellow
Image: Healthier Nutrition Standards Benefit Kids, Kids’ Safe and Healthful Food Project, Figure 13, p. 57.