Vaccines and Conspiracies
Near the end of 2018, the Centers for Disease Control and Prevention data made clear that a small but increasing number of children in the United States were not getting recommended vaccinations.
Read Time: 5 minutes
Published:

Vaccines and Conspiracies
Near the end of 2018, the Centers for Disease Control and Prevention data made clear that a small but increasing number of children in the United States were not getting recommended vaccinations. One in 77 infants born in 2017 did not receive any vaccinations; that’s more than four times as many unvaccinated children as we had at the turn of the century. Some of this may be due to lack of access as those without insurance and those living in rural areas have greater rates of non-vaccination. But part of it may be due to the dismissal of science and scientific evidence, the rising conspiracism in America and its move into the White House.
Vaccinations have always provoked anxiety. But the data on vaccines that are in widespread use are now clear: vaccines are safe and save lives. Nonetheless, conspiracism insists that we don’t know all the facts: things are not as they seem. Conspiracism fuels the anti-vaccine movement in the acceptance of the anecdote (“I heard about one child who got a measles vaccine and developed autism”) over the statistics.
For conspiracists, the safety of all vaccines comes into question not only because of distrust of the pharmaceutical industry, but also because the role and function of government has come into question. For conspiracists, vaccination policy raises questions about the force and power of the government. The growing avoidance of vaccination seems to be a manifestation of interlocking anxieties about the accuracy of media information, about science, and about power.
And, with the unpredictability of the President’s words and actions, we are one menacing sentence away from real public health trouble. Imagine if the President one day were to announce, “People are saying that maybe we don’t really need quite so many vaccines for our kids. After all, look at all this autism that’s around.” This vague conspiratorial phrasing—“people are saying”—this kind of innuendo, would immediately corrode confidence in our collective public health policy. Conspiracism undermines authority.
Universal vaccination is in our common interest. Knowledge about the efficacy of vaccines and the true risk to our children if vaccination rates fall is nonpartisan. Public health has standards of evidence and falsifiability; conspiracists disregard explanation and refuse any form of correction. One of the surprising gifts of 2018 was that vaccination policy and public health policy more generally did not come under great attack. Let’s hope the vaccination conspiracy theories stay subdued in 2019.
Warmly,
Michael Stein & Sandro Galea

HOUSING VOUCHERS KEEP FAMILIES TOGETHER
Homelessness breaks up families. These authors examined the effects of separations of children from parents and of partners from each other in a clinical trial of three housing and service interventions at 12 sites across the country. Families in homeless shelters with at least one child under 16 years old were offered one of three interventions: permanent housing subsidies that reduced rent to 30% of families’ income; temporary housing subsidies with some services directed at housing and employment; and temporary housing in supervised facilities with extensive psychosocial services. Twenty months later, permanent housing subsidies almost halved rates of child separation, and more than halved rates of foster care placements. The other interventions had no meaningful effect on separations. This unique large-scale experiment shows that permanent housing subsidies reduce not only homelessness but also the break-up of families that frequently follows from homelessness.

CANCER MORTALITY ACROSS THE US
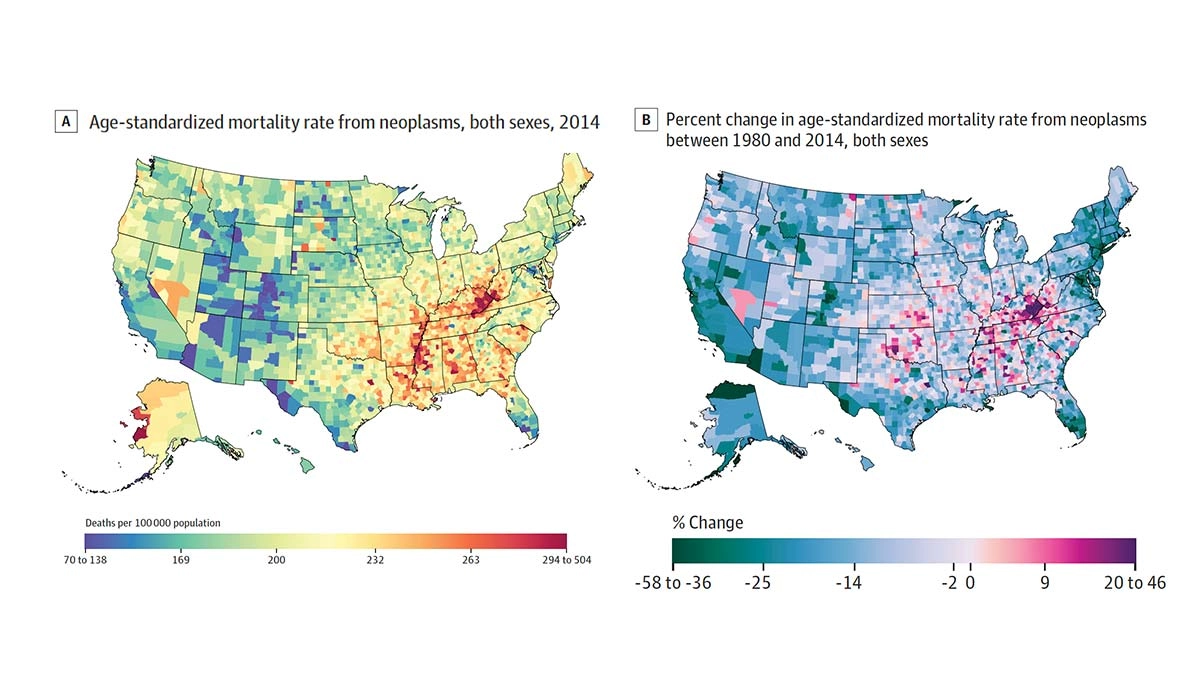
Although cancer mortality has declined by 20.1% across the United States since 1980, a few cancers are on the rise and clustered in particular counties. Ali H. Mokdad and colleagues gathered death records from the National Center for Health Statistics and the Census Bureau to measure exactly how and where cancer mortality changed between 1980 and 2014.
The map on the left shows 2014 county-level mortality for all cancers per 100,000 people, with red areas representing counties with the most cancer-related deaths. The highest mortality is clustered in the Midwest, the South, some counties in the Dakotas, and Alaska. The map on the right displays changes in mortality between 1980 and 2014. Counties experiencing decreases in mortality are represented in blue and green and those experiencing increases are pink and red.
Liver cancer mortality has grown by 87.6% with the largest increases in California, New Mexico, West Texas, and Alaska. Mortality for all other cancers has stayed the same or declined.
Understanding cancer mortality rates for specific counties, rather than national or state averages, allows prevention and treatment programs to be tailored to the needs of specific contexts and populations. —Erin Polka, PHP Fellow
Feature image: Figure 1 (detail), Trends and Patterns of Disparities in Cancer Mortality Among US Counties, 1980-2014, Ali H. Mokdad, Laura Dwyer-Lindgren, Christina Fitzmaurice, Rebecca W. Stubbs, Amelia Bertozzi-Villa, Chloe Morozoff, Raghid Charara. Christine Allen, Mohsen Naghavi, Christopher J. L. Murray, JAMA. 2017;317(4):388-406. doi:10.1001/jama.2016.20324